Technical Analysis: Week 22, 2025
(Gold | USD/JPY | USD/CHF)
Welcome to your weekly edge in the markets, brought to you by WeTrade in collaboration with Trading Writers.
This report is designed to give you clear, actionable insights each week. It’s split into two parts:
1. Weekly thoughts – practical trading strategies, tips, and educational ideas to help sharpen your skills.
2. Setups & signals – our top 3 trade ideas for the week, complete with charts and key levels to watch.
Weekly Thoughts
Everyday there are opportunities to buy and sell in the markets. You can count the pips between market highs and lows and dream of the windfalls they could have bestowed on you.
But just because the market has moved, doesn’t mean to say you could or should have traded it.
For the most part, what we as traders are doing is ‘directional trading’ - we are
1. choosing a direction the market will move and
2. then trying to time it
You must have a consistent method for doing both.
We use longer term weekly charts as our ‘edge’ to take a view on a market (bullish, bearish or neutral) - and use shorter term charts - usually daily charts - to decide when to get in and out.
And by the way this same idea can apply to day traders using 1 hour charts for entries and daily charts for a longer term view.
The long term charts help us “see the forest for the trees” - which as you know means to understand a situation as a whole rather than being overly focused on the details.
Some traders just plot a 200-day moving average on their daily price chart and take bullish trades above it and bearish trades below it. There is a beauty to the simplicity of this rule. But we don’t do it.
Why?
Let’s look at the charts we’ve included in this week’s setups and signals as a demonstration of the idea.
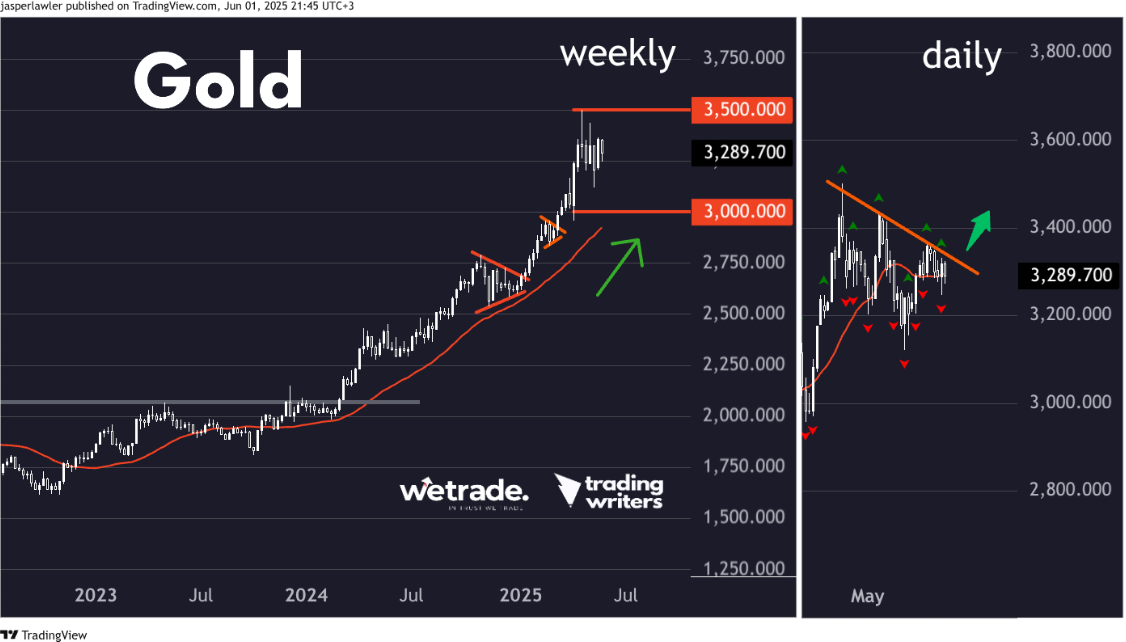
Gold has just experienced a hyperbolic move up, hit a new record high at the $3500 per oz round number and then spent the next 5 weeks chopping up and down (going nowhere!). The big picture situation for gold is that it is digesting its huge gains.
If you’re still trying to buy the dips or trade breakouts during this digestion phase just because the price is above its 200 DMA, you’ll get chopped to pieces unnecessarily.
Yes, price remaining above its 200-day moving average shows you the market is still overall bullish BUT it’s in a different phase - it’s no longer in the fast uptrend it was - short term it is going sideways - so you either trade reversion to the mean strategies - or if you are a trend follower you wait.
Of course it’s easy to see 3500 was a near term top in hindsight. You can never see it straight away but the trick is to keep observing the bigger picture and asking yourself if it’s the same or something changed.
This week we are looking for a sign the gold uptrend is resuming but the choppy sideways action could easily continue.
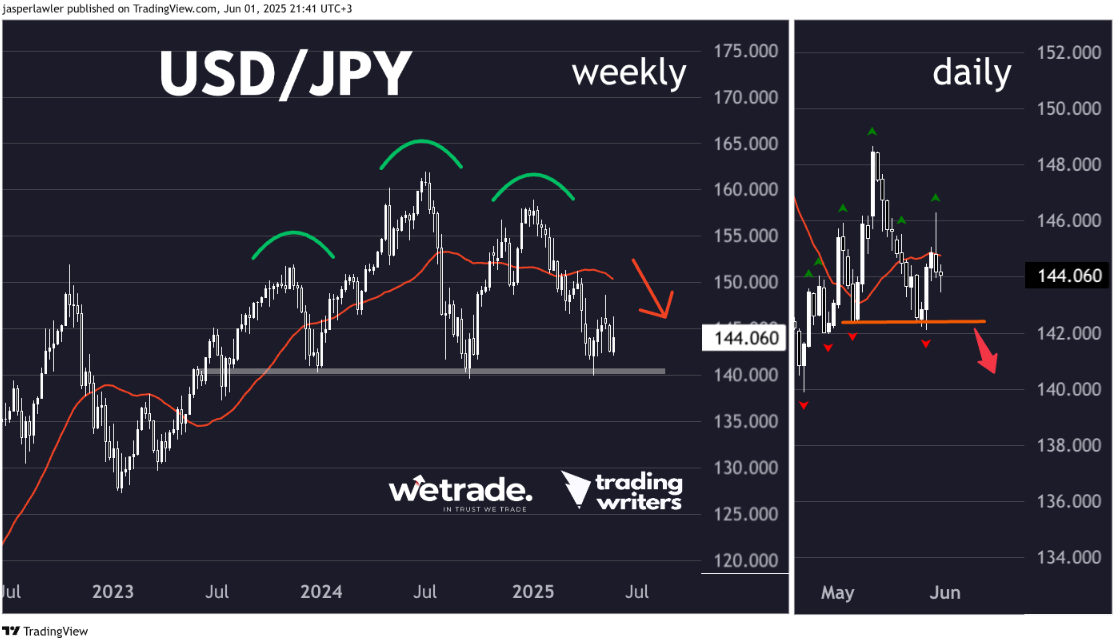
A similar thing could be said for the US dollar, both in the case of the Japanese yen (USD/JPY) and the Swiss franc (USD/CHF).
If you follow the news, taking a view on the dollar is difficult. One day Donald Trump’s tariffs are raised, the next day they are lowered, then a court ruling stops the tariffs then an appeals court undoes the previous ruling! Then there are ideas like ‘de-dollarisation’ as well as the ‘sell the US’ trade where foreign investors are supposedly reducing their exposure to US assets.
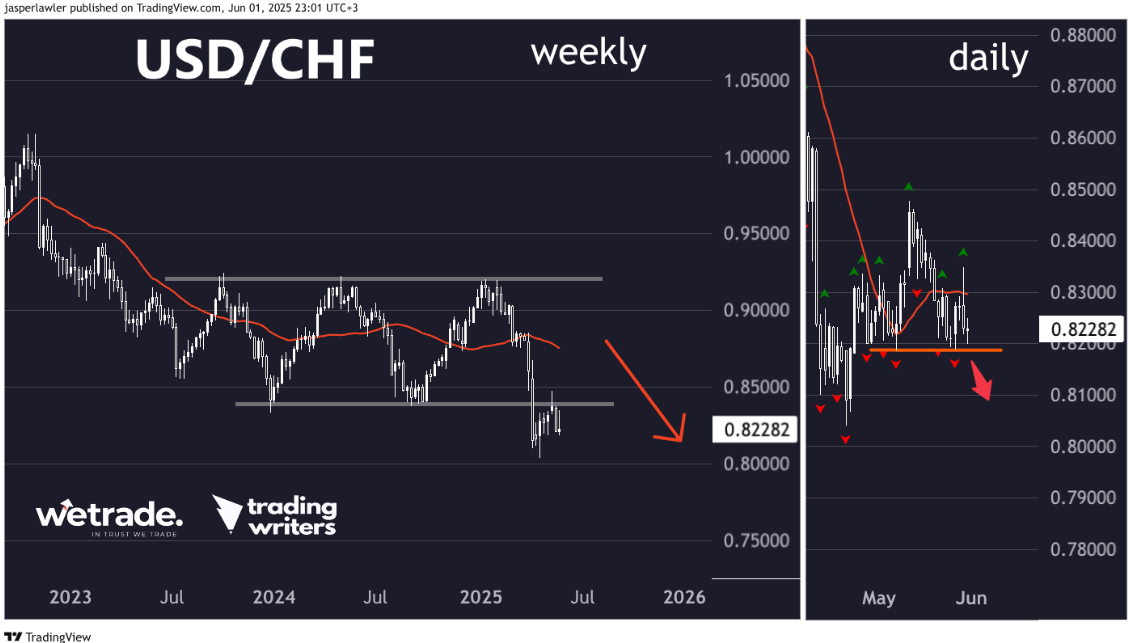
Sometimes - like in the case of USD/CHF it is really as simple as being bearish below a price level - and having no solid view while above it. While below this level we can look for ‘short setups’. In the case of USD/JPY, we see a long term bearish chart pattern and are waiting to see if it completes. We can look for shorts in the meantime or simply wait.
By starting with the weekly chart to understand the big-picture, and then using the daily chart for entry and exit timing, you build a layered approach that’s more robust than relying on a single indicator like the 200-day moving average.
Possibly the most important thing about this combination is that it lets you trade with confidence, knowing you’re in tune with the market.
Setups & Signals
We look at hundreds of charts each week and present you with three of our favourite setups and signals.
Gold (XAU/USD)
Setup
We are bullish gold while it maintains its long term uptrend. Having soared from 3,000 to 3,500 in just 3 weeks, the price has now been consolidating for the last month. We are looking for opportunities to trade the resumption of the uptrend.
Signal
A downtrend line connecting the last 3 peaks on the daily chart offers a possible breakout trade should the price close above it on a daily basis to target a new record high.
USD/JPY
Setup
Dollar-yen is carving out what could be a long term Head & Shoulders pattern with a neckline at 140. Otherwise the price action is range bound with a flat 30-week moving average.
Signal
A ‘mini’ Head & Shoulders pattern might be forming on the daily chart with a neckline at 142. This follows a sharp rally from 142 to over 148 followed by a 100% reversal. A break could target the major long term support at 140 and perhaps lower.
USD/CHF
Setup
The Dollar-Swissie weekly chart is one of the cleanest examples of US dollar weakness after the pair broke below the bottom of the long term 0.84-0.92 range. We are bearish whilst the pair is below 0.84.
Signal
Similarly to USD/JPY, this pair has formed a short term potential H&S pattern with 0.82 as the neckline and the left and right shoulders at 0.835. A break of the neckline could bring about a retest of the 0.80 round figure.
But - as always - that’s just how the team and I are seeing things, what do you think?
Share your ideas with us - OR - send us a request!
Trade with WeTrade!
Every position closed is one step closer to unlocking WeTrade Honours privileges and redeeming exclusive rewards.
Start your trading journey here - Register now
Kickstart your trading of the week here - Login Now